Alertmanager起步
备注
实践环境采用 在Kubernetes集群(z-k8s)部署集成GPU监控的Prometheus和Grafana ,服务访问端口采用 NodePort 简化配置,本文测试脚本配置端口按照 NodePort 配置
Prometheus 通常与处理警报和警报路由的 AlertManager 结合使用:
AlertManager 支持各种报警传输(例如电子邮件或
slack)AlertManager 报警功能可以通过自定义
webhookss扩展,也就是企业可以开发自己的告警平台,然后结合到 AlertManager 的 webhook
备注
Swatto/promtotwilio 提供了一个从 Prometheus监控 接收webooks然后通过 Twilio 发送短信告警
架构
Alertmanager是一个告警服务器,用于处理从一系列客户端(例如 Prometheus监控 )提供的告警,并且分发给预先定义的接收者组(Slack, email 或 Pagerduty)。Alertmanager是Prometheus Stack的一部分,但是也可以作为独立的服务器运行。
通常 Prometheus监控 被配置成直接发送告警给Alertmanager,不过,也可以采用不同的客户端,此时AlertManager提供一个REST路口来提供fire alerts功能.
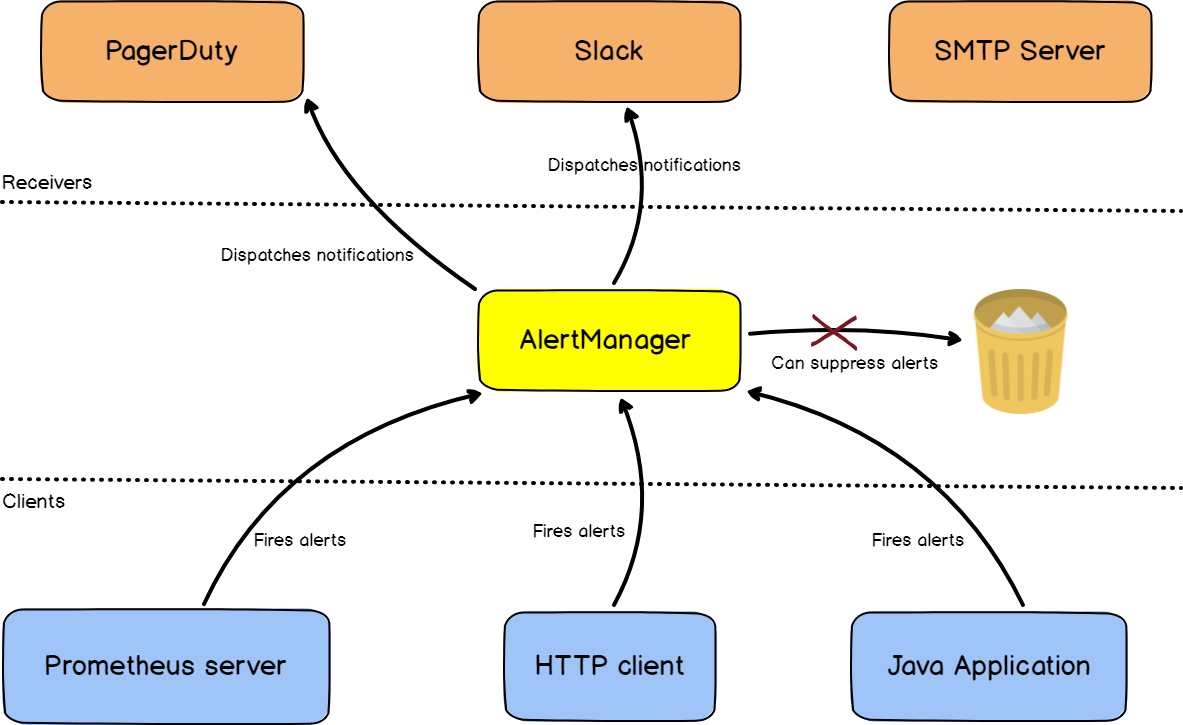
AlertManager 工作原理图
AlertManager routes
AlertManager 采用YAML格式配置文件:
定义
路由routes:路由就是告警所采取的一组路径,用于确定和警报关联的操作: 也就是路由与接收者关联起来
初始路由 (initial route),也称为 “根路由” (root route),是指 发送到AlertManager的每个告警相匹配的路由
一个路由可以有多个兄弟姐妹(siblings)和子(children)路由,并且它自身也是线路。也就是说,路由可以嵌套任意多次,每个级别都为警报定义一个新操作(或receiver)
每个路由定义接收者(receivers),这些接收者是告警的接收者: Slack, 邮件服务,Pagerduty…
路由案例(
根路由=>子路由/根路由=>兄弟姐妹路由(也就是同级别路由)):
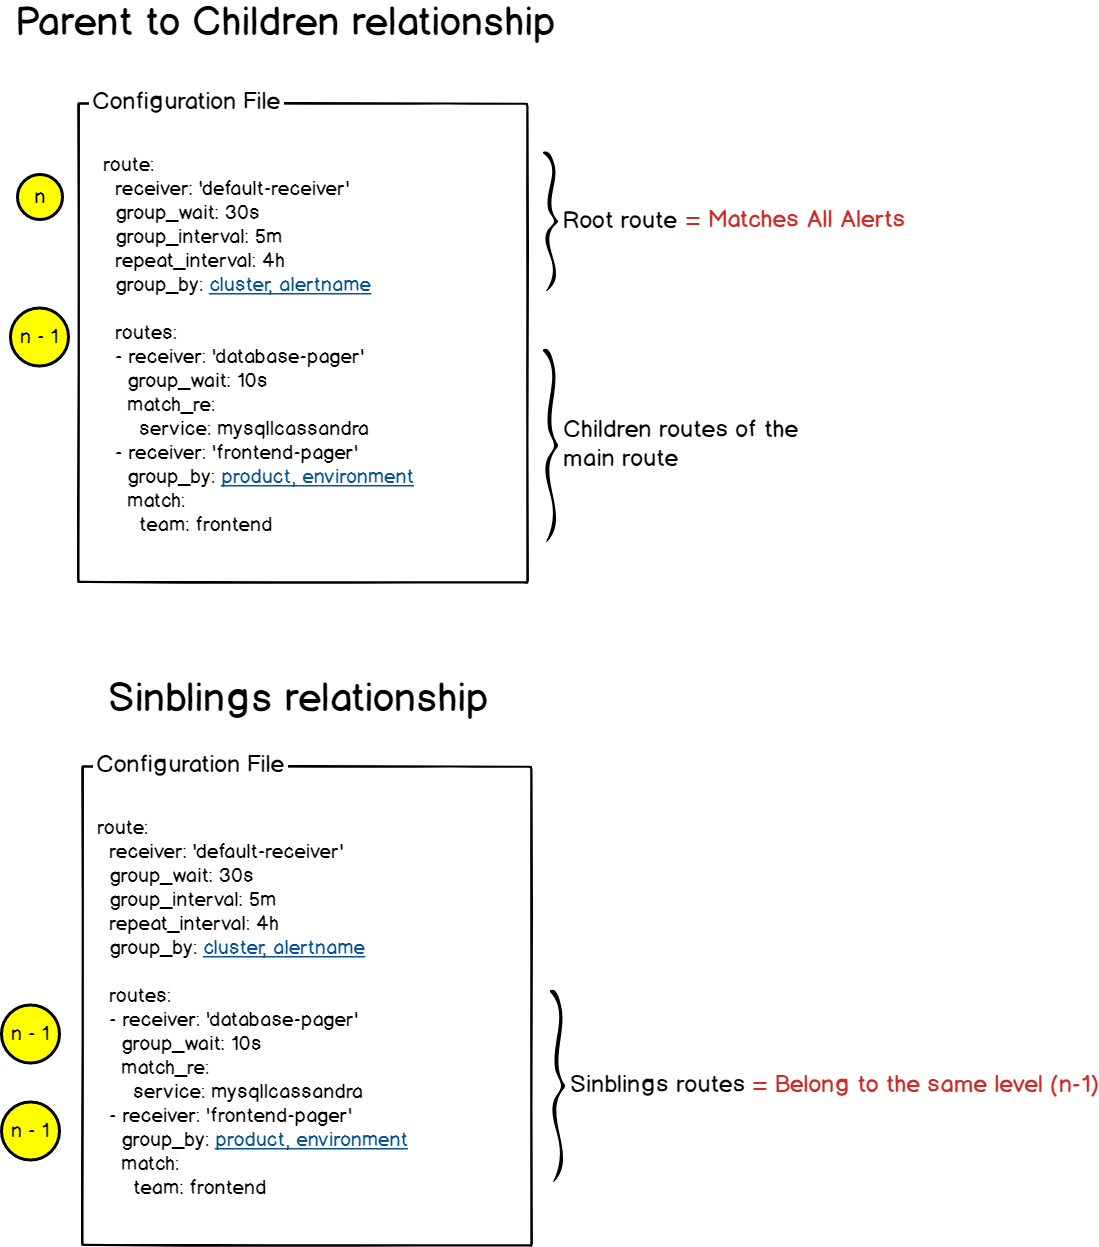
根路由=>子路由 / 根路由=>兄弟姐妹路由 案例
评估路由:
在每个路由(route)上,可以定义一个
continue属性:continue属性值表示,如果同一个级别上的路由已经匹配,是否要继续评估同一级别的其他路由注意
continue属性 不用于确定是否要遍历子路由 ,而仅用于确定兄弟路由(同一级别路由)
Alertmanager会评估
子路由,直到没有剩余路由或者给定级别的路由与当前告警不匹配
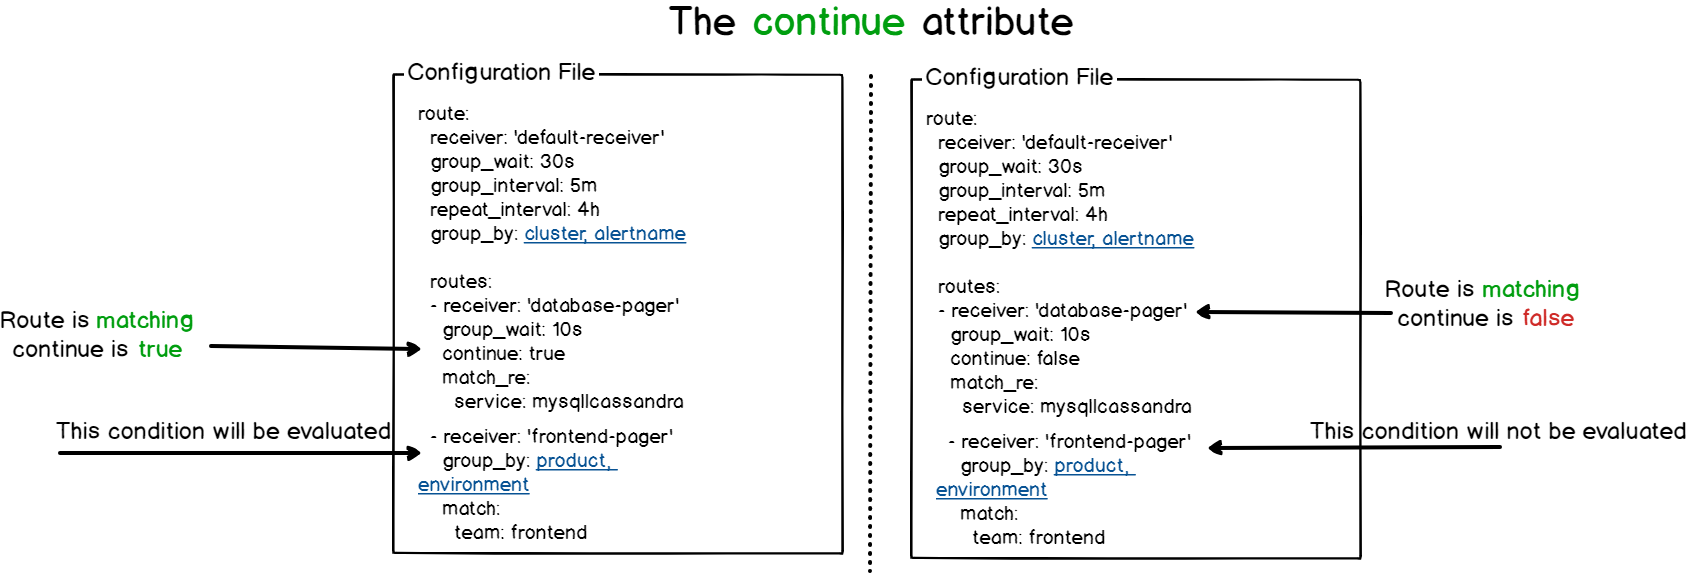
AlertManager 的 continue 属性
安装
和 Prometheus快速起步 类似,采用 zcloud物理主机安装Prometheus 类似方法完成部署 Alertmanger : 共用部分 Prometheus快速起步 配置(运行用户设置为 prometheus )
准备用户账号(已完成过):
sudo groupadd --system prometheus
sudo useradd -s /sbin/nologin --system -g prometheus prometheus
安装和初始配置复制:
VER=0.26.0
mkdir -p /tmp/alertmanager && cd /tmp/alertmanager
wget https://github.com/prometheus/alertmanager/releases/download/v${VER}/alertmanager-${VER}.linux-amd64.tar.gz
tar xvf alertmanager*.tar.gz
cd alertmanager*/

# 这个目录下有3个重要文件
# alertmanager  alertmanager.yml  amtool

sudo mv alertmanager amtool /usr/local/bin/

sudo mkdir -p /etc/alertmanager
sudo cp alertmanager.yml /etc/alertmanager/
获得三个文件:
amtool:amtool用于查看或修改 AlertManager 的当前状态,可以就是可以用来报警静音,使静音过期以及导入静音或查询静音。这是一个Alertmanager的实用陈哥许,而无需直接修改当前告警的配置
alertmanager:alertmanager是AlertManager的可执行程序,也就是服务程序
alertmanager.yml: AlertManager的配置文件,定义了一些示例路由
配置 Systemd进程管理器 服务
/etc/systemd/system/alertmanager.service:
/etc/systemd/system/alertmanager.service¶[Unit]
Description=Alertmanager
Wants=network-online.target
After=network-online.target
StartLimitIntervalSec=500
StartLimitBurst=5
[Service]
User=prometheus
Group=prometheus
Type=simple
Restart=on-failure
RestartSec=5s
ExecStart=/usr/local/bin/alertmanager \
--config.file=/etc/alertmanager/alertmanager.yml \
--storage.path=/data/alertmanager \
--web.listen-address=0.0.0.0:9093
[Install]
WantedBy=multi-user.target
启动服务:
sudo systemctl daemon-reload
sudo systemctl enable --now alertmanager
sudo systemctl status alertmanager
测试alert
向
Altermanager发送一个测试告警:
alertmanager_ip=192.168.6.115
alertmanager_port=30903

curl -XPOST "http://${alertmanager_ip}:${alertmanager_port}/api/v1/alerts" \
  -d \
  "[{
    \"status\": \"firing\",
    \"labels\": {
      \"alertname\": \"测试告警\",
      \"service\": \"test-service\",
      \"severity\":\"warning\",
      \"instance\": \"testinstance.cloud-atlas.io\"
    },
    \"annotations\": {
      \"summary\": \"延迟过高!\"
    }
  }]"
如果正常,终端会收到:
{"status":"success"}
检查 AlertManager 管理WEB页面可以看到添加了如下一条信息:
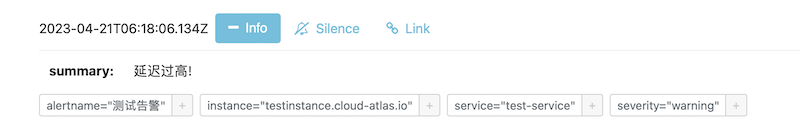
备注
cURL提交json文件 是通用的 curl 方法,在 alertmanager 上可以用来测试数据路由
连接 Prometheus监控 和 AlertManager
需要连接起 Prometheus监控 和 AlertManager,才能使Prometheus通过AlertManager发送告警:
修改
/etc/prometheus/prometheus.yml添加:
/etc/prometheus/prometheus.yml 中添加连接 Alertmanager 配置¶# my global config
global:
scrape_interval: 15s # Set the scrape interval to every 15 seconds. Default is every 1 minute.
evaluation_interval: 15s # Evaluate rules every 15 seconds. The default is every 1 minute.
# scrape_timeout is set to the global default (10s).
# Alertmanager configuration
alerting:
alertmanagers:
- static_configs:
- targets:
- localhost:9093
# Load rules once and periodically evaluate them according to the global 'evaluation_interval'.
rule_files:
# - "first_rules.yml"
# - "second_rules.yml"
- 'alerts/*.yml'
# A scrape configuration containing exactly one endpoint to scrape:
# Here it's Prometheus itself.
scrape_configs:
...
重启prometheus:
sudo systemctl restart prometheus
备注
在完成初步的 Prometheus 连接 AlertManager 之后,接下来我们需要配置告警规则。为了快速起步不用一个个手工配置,可以在 Awesome Prometheus alerts 基础上迭代改进
配置 alertmanager.yml
Alertmanager的配置主要包含两个部分:
路由(route)
接收器(receivers)
修改
/etc/prometheus/prometheus.yml,添加以下配置引用alerts目录下的配置:
/etc/prometheus/prometheus.yml 添加告警规则配置引用¶# my global config
global:
scrape_interval: 15s # Set the scrape interval to every 15 seconds. Default is every 1 minute.
evaluation_interval: 15s # Evaluate rules every 15 seconds. The default is every 1 minute.
# scrape_timeout is set to the global default (10s).
# Alertmanager configuration
alerting:
alertmanagers:
- static_configs:
- targets:
- localhost:9093
# Load rules once and periodically evaluate them according to the global 'evaluation_interval'.
rule_files:
# - "first_rules.yml"
# - "second_rules.yml"
- 'alerts/*.yml'
# A scrape configuration containing exactly one endpoint to scrape:
# Here it's Prometheus itself.
scrape_configs:
...