Ceph Dashboard集成Prometheus
Ceph Dashboard使用了 Grafana通用可视分析平台 面板来实现RBD监控,数据源是从 Prometheus监控 拉取数据,Ceph Prometheus Module 采用Prometheus输出格式输出(export)数据,然后由Grafana面板从Prometheus模块和 Node exporter获取metrics名字。
安装和配置
Prometheus
在我的 私有云架构 规划中我采用两种部署方式:
独立在
zcloud物理服务器上部署 Prometheus监控 和 Grafana通用可视分析平台在Kubernetes集群部署 Kubernetes集群(z-k8s)部署Prometheus-stack
此外,也尝试在两个 z-b-mon-1 和 z-b-mon-2 上部署双机:
z-b-mon-1上 Prometheus快速起步 部署Ceph集群的3个节点
z-b-data-1/z-b-data-2/z-b-data-3安装并运行 Node Exporter
z-b-mon-1上 安装Grafana 并 Grafana配置快速起步
备注
本文最终实践是在物理主机 zcloud 上运行 Prometheus监控 + Grafana通用可视分析平台 来构建监控底盘
激活Prometheus输出
使用以下命令激活 prometheus 模块:
ceph mgr 激活 Prometheus监控 管理模块sudo ceph mgr module enable prometheus
默认Ceph Prometheus模块会监听在所有网络接口的 9283 端口,即以下配置命令是默认设置:
ceph config 可以配置 mgr 的 Prometheus监控 监听IP和端口# 默认监听所有网络接口和端口9283
ceph config set mgr mgr/prometheus/server_addr 0.0.0.0
ceph config set mgr mgr/prometheus/server_port 9283
你可以通过上述命令修订监听IP地址和端口
配置Prometheus
配置
/etc/prometheus/prometheus.yaml添加:
   scrape_configs:
     - job_name: 'ceph'
       honor_labels: true
       static_configs:
         - targets: ['192.168.6.204:9283']
           labels:
             instance: 'ceph_cluster'
         - targets: ['192.168.6.205:9283']
           labels:
             instance: 'ceph_cluster'
         - targets: ['192.168.6.206:9283']
           labels:
             instance: 'ceph_cluster'
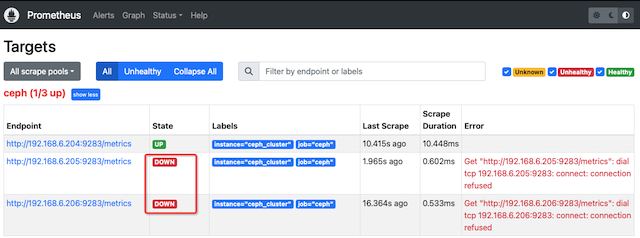
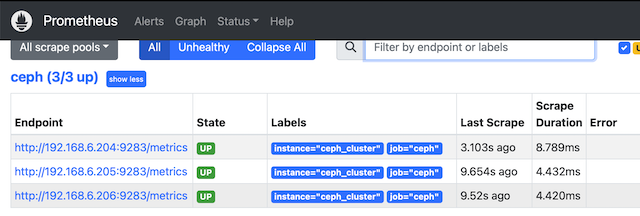
重启prometheus
配置Grafana
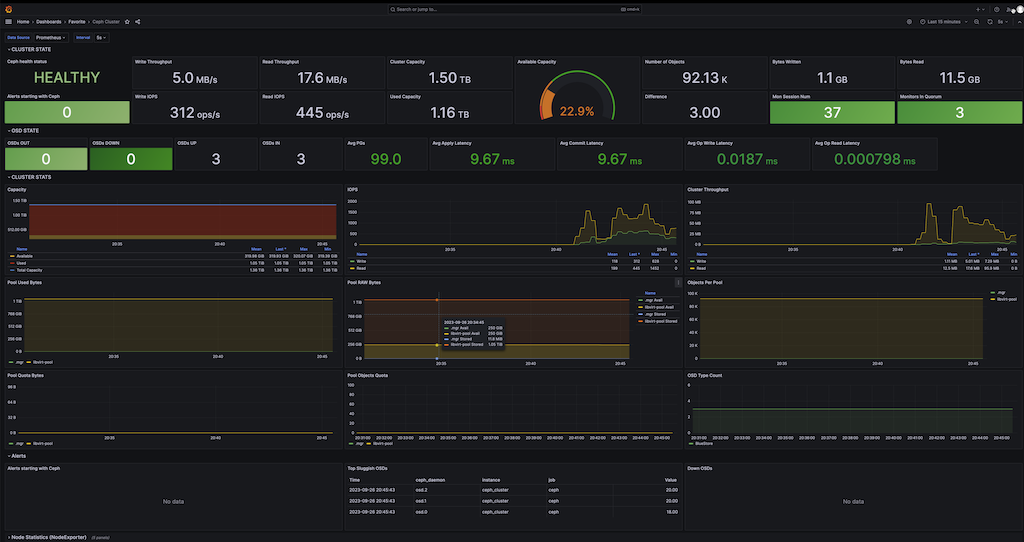
在Grafana的Dashboard网站可以搜索到很多Ceph Dashboard,基本上都是围绕 Ceph官方的 Ceph MGR(s) Prometheus Metrics Endpoints 实现:
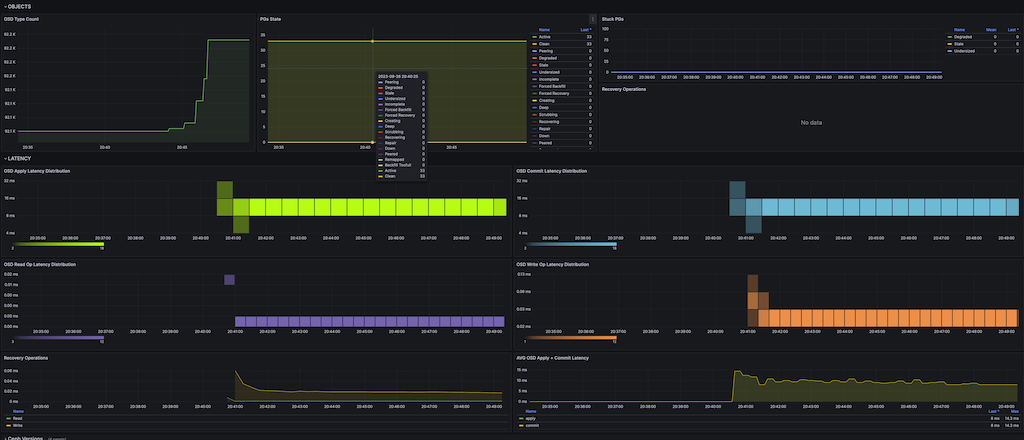
Ceph Cluster (ID: 2842) 以下是我的安装实践截图: