cockpit-pcp
在 Ubuntu Linux 上激活 Cockpit 之后,默认就能实现一些基本的系统监控。不过,要获取CPU/内存更为详细性能数据需要使用 Performance Co-Pilot
备注
可能需要 Cockpit “Cannot refresh cache whilst offline” 报错处理 才能安装 cockpit-pcp
安装
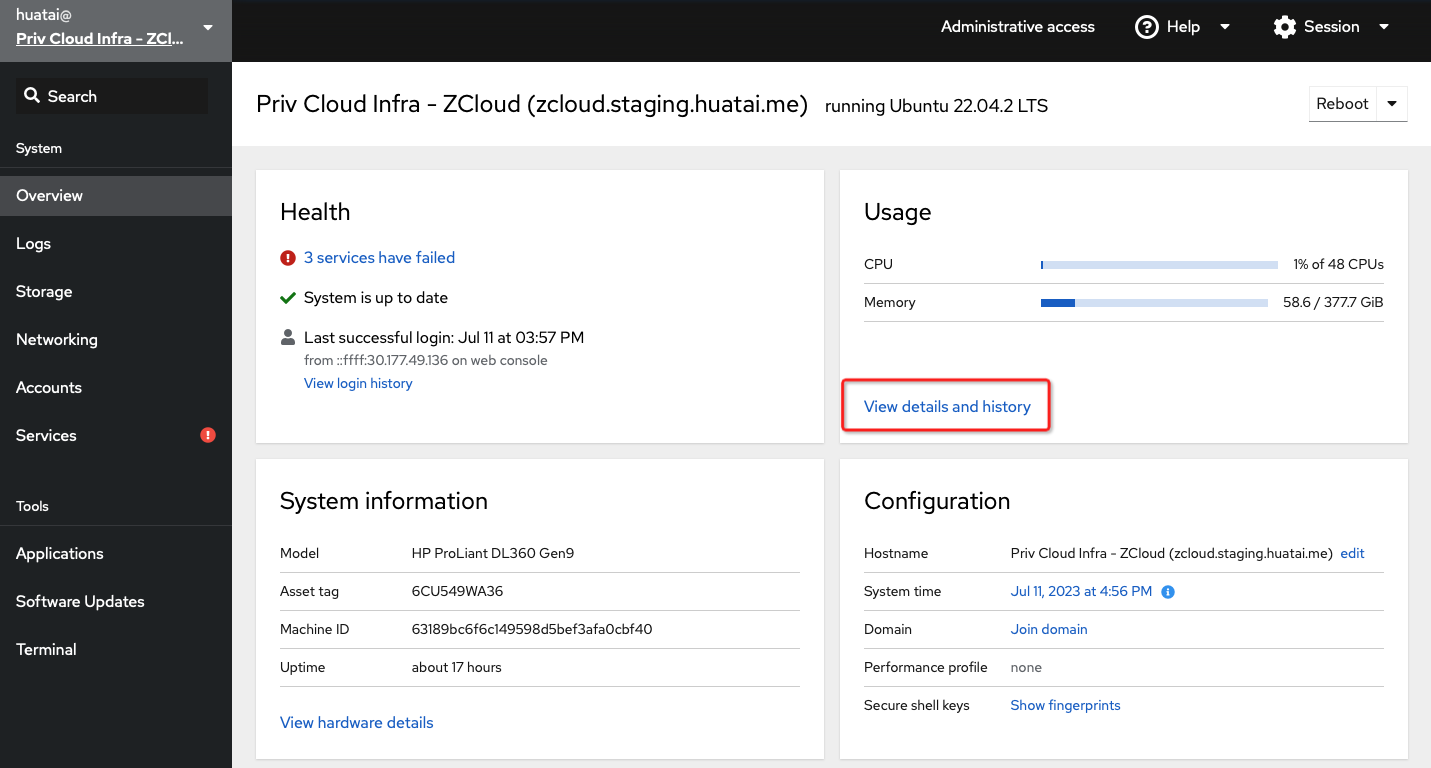
访问 Cockpit 的
Overview页面,点击View details and history:
此时页面下方会提示你
Package cockpit-pcp is missing for metrics history:
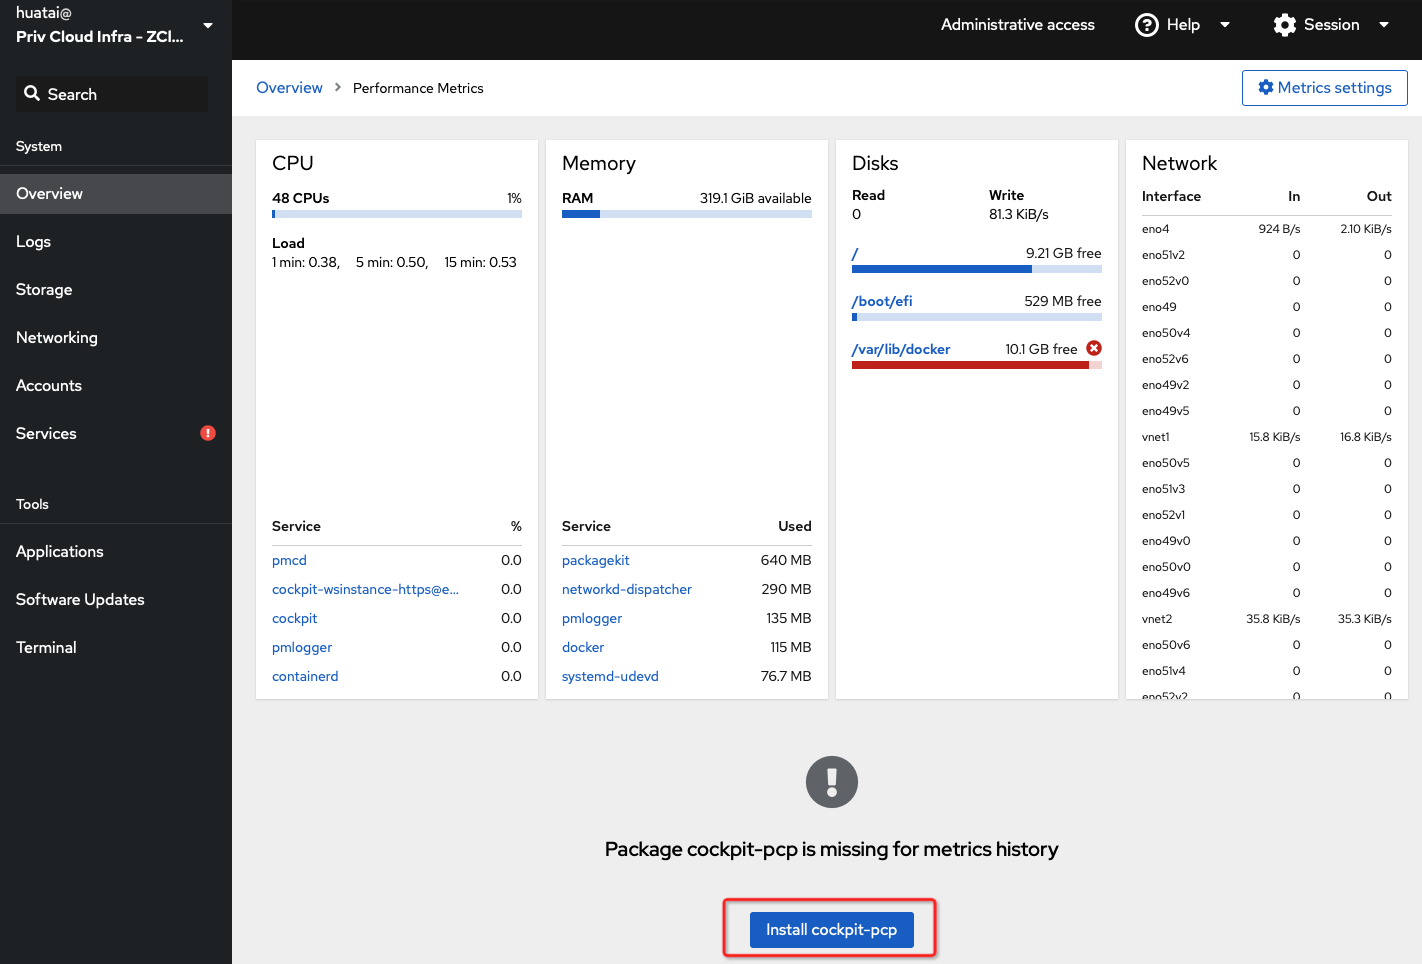
可以点击安装
cockpit-pcp命令行安装方式其实也很简单:
安装 Performance Co-Pilot :
wget -qO - https://pcp.io/GPG-KEY-PCP | sudo apt-key add -
echo "deb https://performancecopilot.jfrog.io/artifactory/pcp-deb-release `lsb_release -c | awk '{print $2}'` main" | sudo tee -a /etc/apt/sources.list
sudo apt update
sudo apt install pcp-zeroconf
然后安装 cockpit-pcp 组件并重启一次 cockpit 服务:
cockpit-pcp 并重启 cockpit 服务刷新¶sudo apt install cockpit-pcp
sudo systemctl restart cockpit
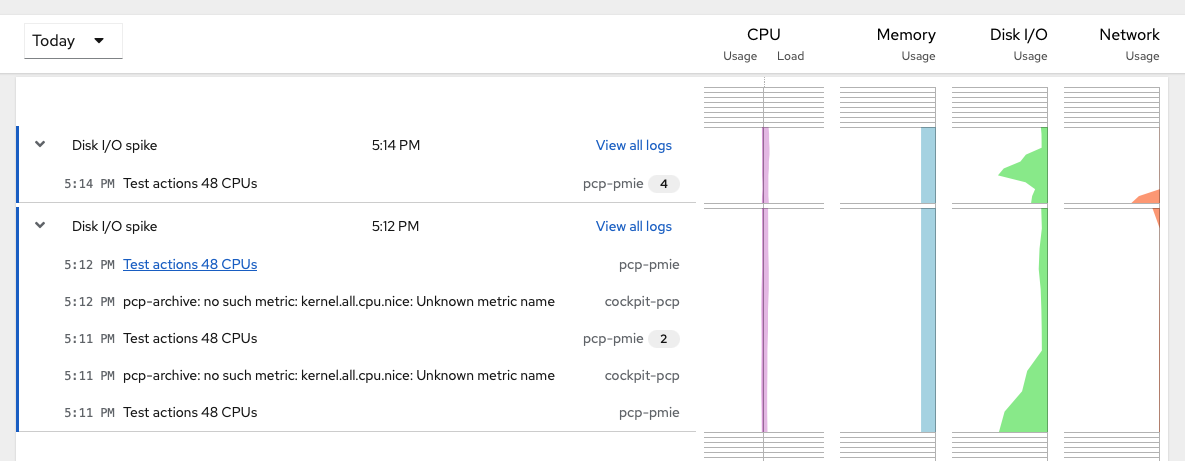
重新访问 Cockpit 的
Overview页面,点击View details and history就可以看到页面下半部分出现了详细的metrics页面(CPU/Memory/Disk/Network):
多服务器Metrics
上述观察服务器的 Metrics 看起来非常简陋,并且虽然 Cockpit 支持多服务器切换观察,但是实际上只支持最多20个服务器。
实际上Cockpit社区也放弃了Dashboard页面(从Cockpit 234移除了),改为采用现代化的 Grafana通用可视分析平台 来实现大规模多服务器监控。这样就避免了上述限制。
Performance Co-Pilot 提供了一个 Performance Co-Pilot Grafana Plugin 来实现主机的metrics输出到本地或远程的 Grafana通用可视分析平台 。
配置被监控主机
要设置主机的metrics发送给 Grafana通用可视分析平台 需要执行一系列步骤,这些步骤在较新的Cockpit版本中可以自动完成:
安装Performance Co-Pilot : 并激活
pmlogger.service来启动数据搜集( 安装步骤中所安装的pcp-zeroconf已自动配置并启动对应服务)激活
pmproxy.service,此时 Performance Co-Pilot 组件会向网络输出一个只读的 metrics query APIpmproxy.service需要 Redis Atlas 数据库,所以当在Overview点击右上角的Metrics Settings并启用Export to network时候,会提示将安装redis
这里应该也可以手工安装redis:
sudo apt install redis
不过,我发现如果没有安装redis也能通过 systemctl start pmproxy.service ,但是配置可能不正确,所以建议先使用平台来激活 pmproxy 然后检查配置用于后续批量部署
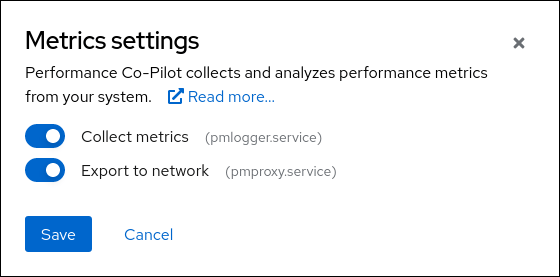
启用 pmproxy.service 服务,也就是对网络输出metrics
如果服务器上已经运行了防火墙,则 Cockpit 还会提示设置防火墙以便共享metrics:
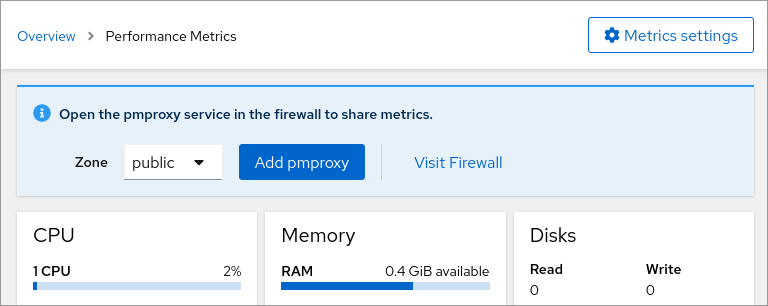
服务器有防火墙情况下, Cockpit 会提示配置对外输出端口
上述页面操作可以参考 PCP Metrics 通过命令行完成配置:
pmproxy 输出主机PCP metrics¶systemctl enable --now redis pmproxy
# if you use firewalld, open port 44322:
firewall-cmd --permanent --add-service pmproxy
firewall-cmd --reload
Grafana设置
首先 安装Grafana (视操作系统安装方法不同),或者在 Kubernetes Atlas 中 使用Helm 3在Kubernetes集群部署Prometheus和Grafana
安装 Performance Co-Pilot Grafana Plugin 安装以后在 Grafana
Administration面板的Plugins中能够找到Performance Co-Pilot,点击Enable激活然后选择
Configuration → Data sources添加PCP Redis数据源
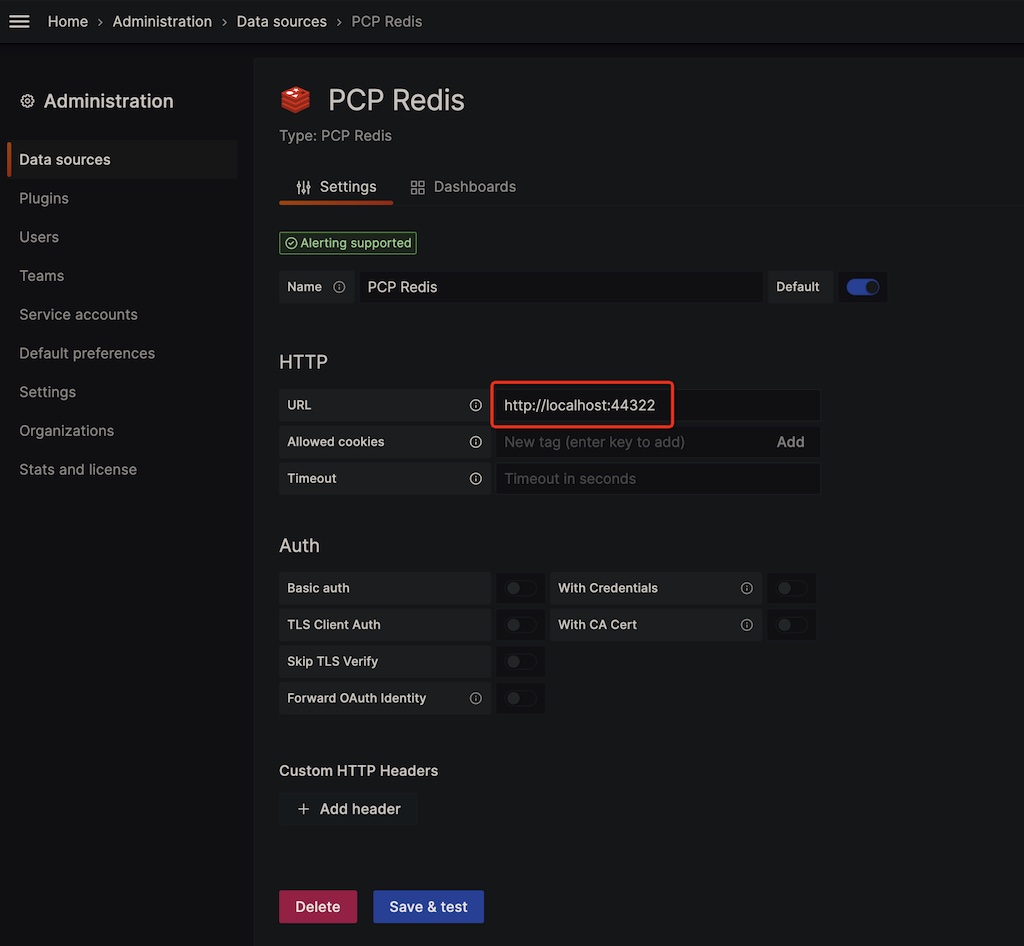
在这个添加页面,配置好访问 PCP Redis 主机URL,然后点击 Save & Test 按钮
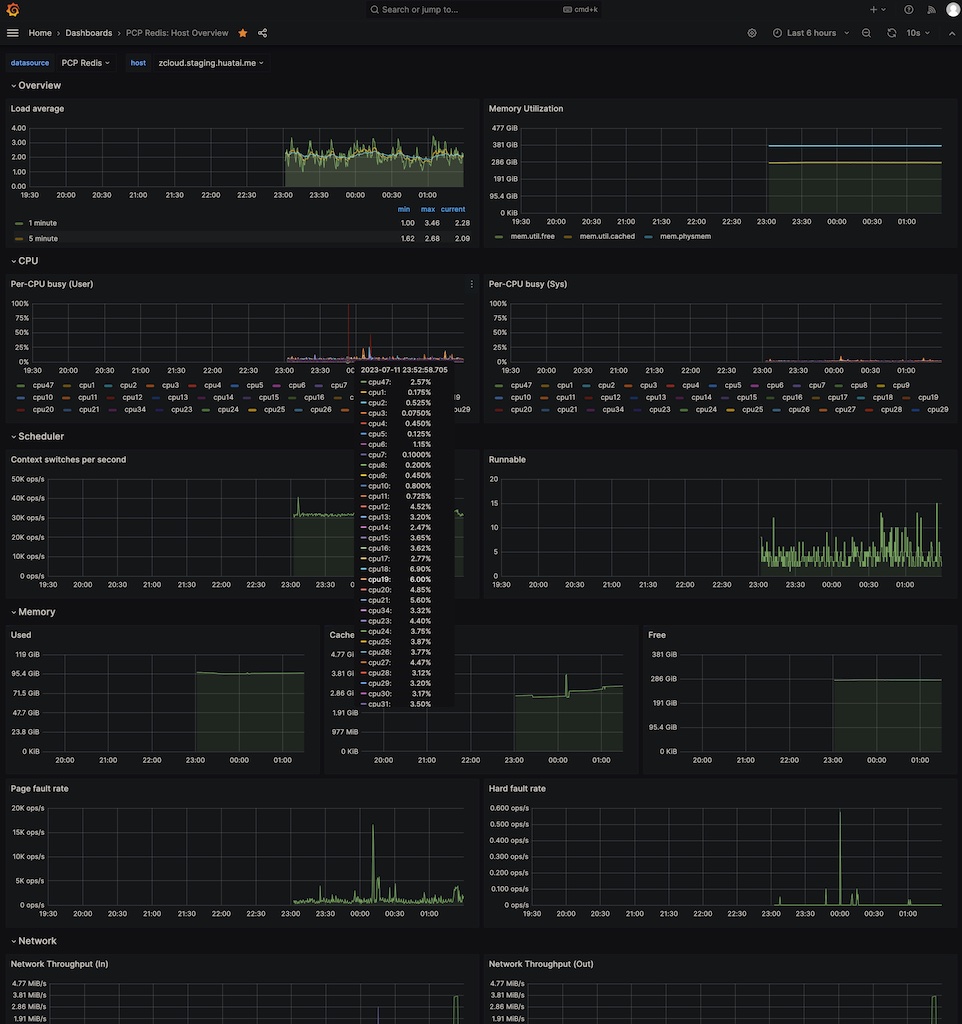
默认数据源也包含了一些 Dashboards ,其中比较有用的是
PCP Redis: Host Overview,请在这个页面点击Dashboards页面,然后选择PCP Redis: Host Overview并点击Import导入导入之后,就可以在Dashboard中找到
PCP Redis: Host Overview访问这个页面就能够看到服务器的星系监控信息:
备注
多服务器监控待续…